
The USD/JPY lost its final 2022 advances this week as traders predict a spring economic recovery. In December, US inflation hit a four-decade high, but not enough to raise Treasury rates.
Economic damage caused by short-term labor shortages was not factored into the Omicron diagnosis. The global economy’s growth potential led the Dollar down in most key pairings on growing risk acceptability.
To put it simply, stagnating US Treasury rates and the subsequent loss of 115.00 and then 114.00 support put the Dollar in trouble.
As expected, the annual US Consumer Price Index (CPI) climbed 7% in December, after rising 6.8% in November.
Even though the core rate rose to 5.5%, a substantial increase from November’s 4.9%, the credit markets had priced in the outcome. Following the publication, the 10-year Treasury rate fell two basis points to 1.725%.
US producer prices grew 9.7% year-on-year in December, while core prices rose 8.3%, pointing to months of rising retail costs as rises are passed on to consumers.
The 10-year yield rose 27 points in six trading days, from 1.512% on December 31 to 1.780% on Monday. It had fallen 7 basis points to 1.708% at Thursday’s end, but hawkish remarks from multiple Fed officials pushed it back to 1.747% on Friday.
For six weeks, Treasury rates have reacted to rising inflation and shifting Fed policies. The 10-year yield rose sharply from 1.341% on December 3 to 1.78% on January 7.
The pair traded from 112.74 on December 31 to 116.12 on January 5. The lack of Treasury rates to climb has exposed the USD/JPY to a technical decline.
The Fed is primarily expected to start a rate cycle on March 16. If the Fed raises rates three times by 0.25% by December, the fed funds rate will be 1%.
After the 2008-2009 economic meltdown, the Fed held the standard rate at 0.25% for over seven years. The 10-year yield ranged from 4% to 1.5%, with an average considerably above 2%. Those years’ QE initiatives didn’t target economically relevant Treasury rates.
The Fed’s massive bond-buying program, which began in March 2020, aimed to decrease key Treasury rates. The 10-year yield hit an all-time low in March 2020 under that arrangement.
The Fed’s policy reversal has thrown the fed funds rate’s link with the Treasury market into doubt. The central question for the USD/JPY is the 10-year yield hike.
The solution probably won’t come until the Fed starts reducing its holdings next year.
The Fed’s larger rate objectives will be signaled by the speed and mix of maturing bonds. Because the Bank of Japan’s (BOJ) monetary policy is zero, the USD/JPY is very sensitive to rate changes.
Japan’s economic figures were predictable. The November Leading Economic and Coincident Indexes were better than projected, but not the January Eco Watchers Survey Current Poll. CPI fell in December as producer prices fell in Japan in December.
US retail sales fell in all categories in December, while November’s statistics were revised downward.
USD/JPY Forecasts
The drop from 115.00 on Wednesday to 114.00 on Friday calls into question the rest of the USD/JPY advances since early December and exposes the area to 112.00 and 111.00.
If US Treasury rates remain below 2.0% and a risk-on market mood flourishes, the USD/JPY will struggle to rebound.
Technical support is down to 113.00, but the region below 112.00 was only traded twice in early October and is highly fragile.
On Tuesday, the Boj session will not result in any policy changes, and any new economic stimulus package will have a limited market impact. For the BOJ, the December CPI does not affect inflation.
U.S. housing data for December includes existing home sales, building permits, and construction starts, all fascinating but hardly market movers.
To balance increased risk-acceptance and stagnant US Treasury rates, the USD/JPY tendency is neutral to downward.
USD/JPY Technical Forecast
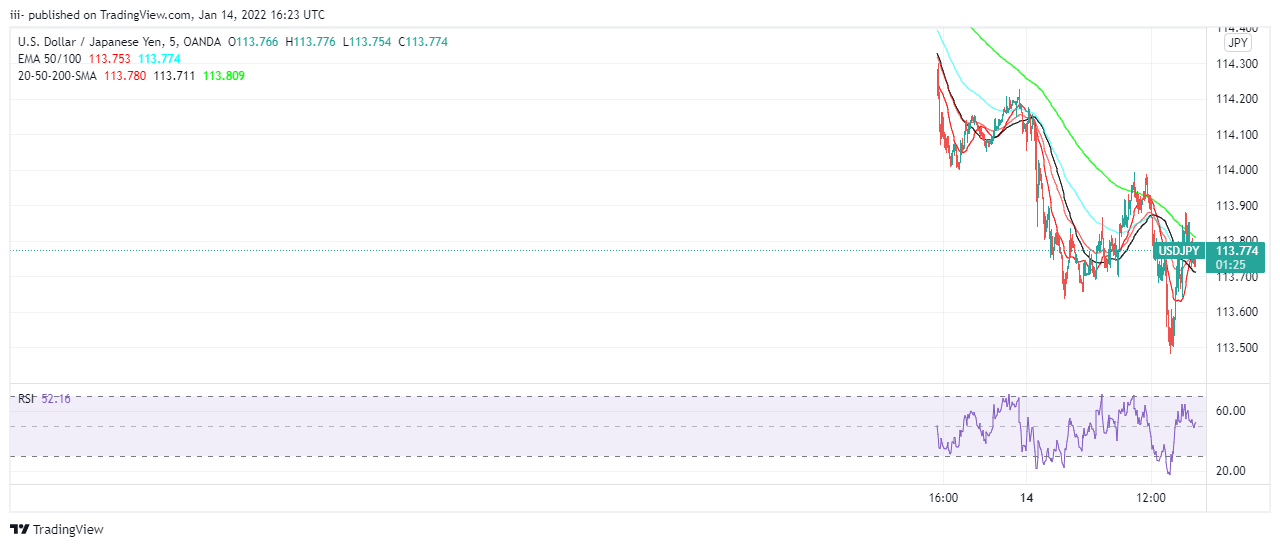
USD/JPY CHART Source: Tradingview.com
The MACD breach of the signal line on Tuesday was very predicative. Each session after that, the USD/JPY fell. Intensifying divergence and a steepening price line suggest additional USD/JPY losses.
The Relative Strength Index (RSI) reached its mid-point on Wednesday, and the dramatic five-session decrease since January 6 suggests further slippage. Volatility has barely slightly rebounded from January 3’s low. This is not a stop-loss decrease.
On Wednesday and Thursday, the 21-day and 50-day moving averages crossed. Neither showed much support.
There is solid support at Friday’s trough of 113.49. The 23.6% Fibonacci level of January 2021 to January 2022 uptrend at 112.94 and the 100-day MA at 113.01 provide solid support.
Little assistance at 112.70 from early December trade is below. As stated previously, the range was crossed in one session on October 11.